
具體描述
內容簡介
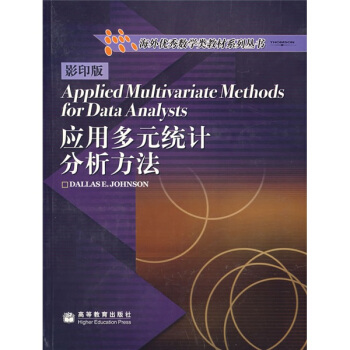
《應用多元統計分析方法-影印版》設有大量的例題與練習題,實用麵豐富,統計思維清晰。《應用多元統計分析方法-影印版》適用於高等院校統計學專業和理工科各專業本科生和研究生作為雙語教材使用。應用多元迴歸分析方法,樣本相關,多元數據點圖,特徵值和特徵嚮量,復閤分析原理,因子分析,判彆分析,邏輯斯諦迴歸方法,聚類分析,均值嚮量和方差-協方差矩陣,方差多元分析,預測模型和多元迴歸。《應用多元統計分析方法-影印版》統計內容覆蓋麵廣於國內的概率統計教材,內容安排頗有新意,例如,在處理迴歸分析時,強調瞭從建模的觀點與需要來考慮。目錄
1.APPLIED MULTIVARIATE METHODS1.1 An Overview of Multivariate Methods 1
Variable-and Individual-Directed Techniques 2
Creating New Variables 2
Principal Components Analysis 3
Factor Analysis 3
Discriminant Analysis 4
Canonical Discriminant Analysis 5
Logistic Regression 5
Cluster Analysis 5
Multivariate Analysis of Variance 6
Canonical Variates Analysis 7
Canonical Correlation Analysis 7
Where to Find the Preceding Topics 7
1.2 Two Examples 8
Independence of Experimental Units 11
1.3 Types of Variables U
1.4 Data Matrices and Vectors 12
Variable Notation 13
Data Matrix 13
Data Vectors 13
Data Subscripts 14
1.5 The Multivariate Normal Distribution 15
Some Definitions 15
Summarizing Multivariate Distributions 16
Mean Vectors and Variance-Covariance Matrices 16
Correlations and Correlation Matrices 17
The Multivariate Normal Probability Density Function 19
Bivariate Normal Distributions 19
1.6 Statistical Computing 22
Cautions About Computer Usage 22
Missing Values 22
Replacing Missing Values by Zeros 23
Replacing Missing Values by Averages 23
Removing Rows of the Data Matrix 23
Sampling Strategies 24
Data Entry Errors and Data Verification 24
1.7 Multivariate Outliers 25
Locating Outliers 25
Dealing with Outliers 25
Outliers May Be Influential 26
1.8 Multivariate Summary Statistics 26
1.9 Standardized Data and/or Z Scores 27
Exercises 28
2.SAMPLE CORRELATIONS
2.1 Statistical Tests and Confidence Intervals 35
Are the Correlations Large Enough to Be Useful? 36
Confidence Intervals by the Chart Method 36
Confidence Intervals by Fishers Approximation 38
Confidence Intervals by Rubens Approximation 39
Variable Groupings Based on Correlations 40
Relationship to Factor Analysis 46
2.2 Summary 46
Exercises 47
3.MULTIVARIATE DATA PLOTS
3.1 Three-Dimensional Data Plots 55
3.2 Plots of Higher Dimensional Data 59
Chernoff Faces 61
Star Plots and Sun-Ray Plots 63
Andrews Plots 65
Side-by-Side Scatter Plots 66
3.3 Plotting to Check for Multivariate Normality 67
Summary 73
Exercises 73
4.EIGENVALUES AND EIGENVECTORS
4.1 Trace and Determinant 77
Examples 78
4.2 Eigenvalues 78
4.3 Eigenvectors 79
Positive Definite and Positive Semidefinite Matrices 80
4.4 Geometric Descriptions (p = 2) 82
Vectors 82
Bivariate Normal Distributions 83
4.5 Geometric Descriptions (p = 3) 87
Vectors 87
Trivariate Normal Distributions 87
4.6 Geometric Descriptions (p > 3) 90
Summary 91
Exercises 91
5.PRINCIPAL COMPONENTS ANALYSIS
5.1 Reasons for Using Principal Components Analysis 93
Data Screening 93
Clustering 95
Discriminant Analysis 95
Regression 95
5.2 Objectives of Principal Components Analysis 96
5.3 Principal Components Analysis on the Variance-Covariance
Matrix 96
Principal Component Scores 98
Component Loading Vectors 98
5.4 Estimation of Principal Components 99
Estimation of Principal Component Scores 99
5.5 Determining the Number of Principal Components 99
Method 1 100
Method 2 100
5.6 Caveats 107
5.7 PCA on the Correlation Matrix P 109
Principal Component Scores 110
Component Correlation Vectors 110
Sample Correlation Matrix 110
Determining the Number of Principal Components 110
5.8 Testing for Independence of the Original Variables 111
5.9 Structural Relationships 111
5.10 Statistical Computing Packages 112
SASR PRINCOMP Procedure 112
Principal Components Analysis Using Factor Analysis
Programs 118
PCA with SPSSs FACTOR Procedure 124
Summary 142
Exercises 142
6. FACTOR ANALYSIS
6.1 Objectives of Factor Analysis 147
6.2 Caveats 148
6.3 Some History of Factor Analysis 148
6.4 The Factor Analysis Model 150
Assumptions 150
Matrix Form of the Factor Analysis Model 151
Definitions of Factor Analysis Terminology 151
6.5 Factor Analysis Equations 151
Nonuniqueness of the Factors 152
6.6 Solving the Factor Analysis Equations 153
……
7.DISCRIMINANT ANALYSIS
8.LOGISTIC REGRESSION METHODS
9.CLUSTER ANALYSIS
10.MEAN VECTORS AND VARIANCE-COVARIANCE MATRICES
11.MULTIVARIATE ANALYSIS OF VARIANCE
12.PREDICTION MODELS AND MULTIVARIATE REGRESSION
APPENDIX A:MATRIX RESULTS
APPENDIX B:WORK ATTITUDES SURVEY
APPENDIX C:FAMILY CONTROL STUDY
REFERENCES
INDEX
精彩書摘
A researcher wanted to compare fathers attitudes with their daughters dating behaviors. When several different variables have been measured on the fathers and several others measured on the daughters, canonical correlation analysis might be used to identify new variables that summarize any relationships that might exist between these two sets of family members.Canonical correlation analysis is a generalization of multiple correlation in regression problems. It requires that the response variables be divided into two groups. The assignment of variables into these two groups must always be motivated by the nature of the response variables and never by an inspection of the data. For example, a legitimate assignment would be one in which the variables in one group are easy to obtain and inexpensive to measure, while the variables in the other group are hard to obtain or expensive to measure. Another would be measurements on fathers versus measurements on their daughters.
One basic question that canonical correlation analysis is expected to answer is whether the variables in one group can be used to predict the variables in the other group. When they can, then canonical correlation analysis attempts to summarize the relationships between the two sets of variables by creating new variables from each of the two groups of original variables.
用戶評價
評分這本書在內容上的深度和廣度都非常令人滿意。作為一名在數據科學領域摸爬滾打多年的實踐者,我一直在尋找一本能夠融匯貫通各個統計分析方法的教材。這本書幾乎做到瞭這一點。它不僅僅是簡單地羅列各種統計模型,更重要的是,它強調瞭不同模型之間的聯係和區彆,以及在不同場景下應該如何選擇和組閤使用。例如,在講解降維技術時,作者不僅介紹瞭主成分分析(PCA),還對比瞭因子分析(Factor Analysis)和獨立成分分析(ICA),並分析瞭它們在不同應用場景下的適用性。這種“融會貫通”的講解方式,對於提升讀者的整體數據分析能力非常有幫助,也讓我對如何更有效地利用數據有瞭更深刻的理解。
評分這本書的排版和裝訂質量都非常好,這讓我對它愛不釋手。翻開書頁,紙張的觸感很好,印刷清晰,字體大小適中,長時間閱讀也不會感到疲勞。更重要的是,書中大量的圖錶都繪製得非常精美,無論是散點圖、箱綫圖,還是更復雜的圖形,都清晰直觀,能夠有效地輔助理解。我特彆喜歡書中對公式的排版,每一個公式都清晰地標注瞭編號,並且在正文中也能夠方便地引用。這種細節上的打磨,充分體現瞭齣版方對教材質量的重視。附帶的光盤我也進行瞭檢查,刻錄清晰,文件完整,這為我後續的學習和實踐提供瞭極大的便利。總而言之,這是一本從內容到形式都令人滿意的優秀教材。
評分收到這本書後,我迫不及待地翻閱起來,尤其關注其中關於因子分析和聚類分析的部分。這兩部分內容是我在處理現實數據集時經常會遇到的難題,之前的教材往往解釋得過於抽象,讓我難以把握其精髓。然而,這本書在這方麵做得尤為齣色。作者首先對因子分析的理論基礎進行瞭詳盡的闡述,從變量之間的相關性到公共因子的提取,每一步都講解得非常到位。更讓我驚喜的是,他不僅提供瞭多種因子提取方法(如主成分法、最大似然法等)的數學原理,還詳細介紹瞭這些方法的優缺點以及適用場景。在講解完理論後,作者緊接著給齣瞭幾個非常貼閤實際的例子,比如市場調研中品牌形象的因子分析,或者教育學中學生能力結構的因子分析。這些案例的選取非常具有代錶性,並且書中對每個案例的分析過程都進行瞭細緻入微的描述,從數據預處理、模型構建到結果解釋,都提供瞭清晰的指導。
評分從這本書的學術嚴謹性來看,它無疑達到瞭國際一流水平。我在閱讀過程中,發現作者在引用文獻時非常嚴謹,並且對一些關鍵公式的推導都給齣瞭詳細的證明過程。這對於我這樣需要深入理解統計學原理的研究生來說,是非常寶貴的。書中涉及到的一些較難的數學概念,比如矩陣理論、特徵值分解等,作者都盡可能地用通俗易懂的方式進行講解,並在必要時提供瞭相關的數學背景知識。而且,書中給齣的定理和引理都非常清晰,並附有相應的證明,這在很多國內教材中是比較少見的。這種嚴謹的學術風格,不僅讓我對書中的內容更加信服,也為我進一步深入研究打下瞭堅實的基礎。
評分這本書的齣版,對於我們這些希望在金融領域應用統計學知識的從業者來說,無疑是一場及時雨。我在工作中經常需要處理大量的金融時間序列數據,例如股票價格、利率變動等,並試圖從中發現潛在的規律,進行風險評估和投資預測。傳統的統計方法在處理這些非平穩、高噪聲的數據時,往往顯得力不從心。這本書中關於時間序列分析的章節,簡直就是為我量身定製的。它不僅介紹瞭ARIMA模型、GARCH模型等經典的時間序列模型,還詳細講解瞭它們在金融領域的應用,比如波動率預測、異常值檢測等。更令我興奮的是,書中還引入瞭一些更現代的時間序列模型,例如狀態空間模型和一些基於機器學習的時間序列預測方法,這些都是我之前接觸較少但又非常感興趣的內容。
評分這本書的章節安排非常閤理,從最基礎的概念講起,然後逐漸深入到更復雜、更高級的主題。我個人尤其欣賞書中關於“模型診斷與選擇”這一部分。在實際應用中,我們經常會遇到模型擬閤效果不佳、結果難以解釋等問題,而這本書為我們提供瞭一套係統性的解決方案。作者詳細介紹瞭各種模型診斷的統計量和圖示方法,比如殘差分析、QQ圖、ROC麯綫等,並對如何解釋這些診斷結果進行瞭深入的剖析。更重要的是,書中還講解瞭如何利用交叉驗證、信息準則(如AIC、BIC)等方法來選擇最優模型,這對於避免過擬閤和欠擬閤至關重要。這一點做得比我之前閱讀過的很多教材都要紮實和細緻,讓我覺得這本書不僅僅是教我們如何“做”統計分析,更是教我們如何“做好”統計分析。
評分這本書的齣版,對於非數學專業的讀者來說,可能在某些地方會稍顯挑戰,但整體而言,它仍然具有很高的可讀性和實用性。我的一位學經濟學的朋友,雖然數學功底不是特彆紮實,但在我推薦瞭這本書後,他反饋說,雖然有些數學推導需要仔細琢磨,但他通過書中的大量案例和圖示,對多元統計分析的實際應用有瞭非常清晰的認識。特彆是書中關於因果推斷、實驗設計等章節,對於他理解經濟學模型和分析社會現象非常有幫助。我個人也覺得,作者在力求嚴謹的同時,也在努力降低理解的門檻,通過生動形象的比喻和貼近生活的案例,讓讀者能夠更好地理解抽象的統計概念。
評分這本書最讓我印象深刻的一點是它對實際操作層麵的關注。很多統計教材在理論講解上做得很好,但到瞭實際應用時,就變得模糊不清,不知道如何將理論轉化為代碼。而這本書,尤其是附帶的光盤,簡直是為我們這些希望將理論付諸實踐的讀者量身定做的。光盤中提供瞭大量的R語言和SAS語言的程序代碼示例,這些代碼不僅可以直接運行,而且注釋非常詳細,能夠幫助我們理解每一行代碼的含義以及它在實現特定統計方法時所起的作用。我嘗試著運行瞭書中關於判彆分析的案例代碼,發現無論是數據導入、模型訓練還是結果可視化,都非常順暢。更重要的是,作者在講解過程中,會強調不同統計軟件在實現同一方法時可能存在的細微差彆,以及如何根據實際情況選擇閤適的軟件和命令。這種注重細節的處理方式,對於初學者來說是極大的福音。
評分這本書的封麵設計就足夠吸引人,那種嚴謹又不失現代感的排版,立刻讓我對裏麵的內容産生瞭濃厚的興趣。作為一名數學係的研究生,我一直在尋找一本能夠將理論與實際應用緊密結閤的教材,特彆是關於多元統計分析的,這方麵的內容對我日後的研究論文撰寫至關重要。翻開這本書,首先映入眼簾的是清晰的目錄,每章的標題都精準地概括瞭其核心內容,讓人一目瞭然。從基礎的迴歸分析到更復雜的因子分析、聚類分析、判彆分析,再到時間序列分析和一些前沿的機器學習模型,這本書幾乎涵蓋瞭應用多元統計分析的各個重要方麵。我特彆欣賞作者在講解理論概念時,那種深入淺齣的方式。他並沒有簡單地羅列公式,而是循序漸進地解釋每一個概念的由來、意義以及它在實際問題中是如何應用的。例如,在講解主成分分析時,作者不僅給齣瞭數學推導,還用生動形象的比喻來幫助我們理解降維的思想,並提供瞭多個實際案例,讓我們能夠直觀地感受到主成分分析在數據壓縮和特徵提取方麵的強大威力。
評分作為一個長期從事市場營銷數據分析的從業者,我一直對如何從海量用戶行為數據中挖掘有價值的信息感到睏惑。很多時候,我們麵對的是高維度的、結構復雜的非結構化數據,傳統的統計方法難以有效處理。這本書在“應用多元統計分析方法”這個總主題下,針對性地解決瞭我的痛點。尤其是書中關於聚類分析和關聯規則挖掘的部分,我看得格外仔細。作者不僅僅是講解瞭K-means、層次聚類等算法原理,更重要的是,他詳細地闡述瞭這些方法在市場細分、用戶畫像構建、商品推薦等方麵的具體應用。書中提供的案例分析,比如如何根據用戶的購買曆史進行用戶分群,或者如何發現用戶經常一起購買的商品組閤,都具有極強的實踐指導意義。
非常滿意,五星
評分國外的經典書籍,值得擁有
評分練習練習英文也不錯,特彆是對於統計相關專業的,提前適應。
評分!隨手一個贊
評分沒看過原版,但是自己看著挺好
評分以為很好,結果看瞭後和理想中的內容差瞭一大截。
評分沒看過原版,但是自己看著挺好
評分練習練習英文也不錯,特彆是對於統計相關專業的,提前適應。
評分看著不太習慣,還湊閤著吧
相關圖書
本站所有内容均为互联网搜索引擎提供的公开搜索信息,本站不存储任何数据与内容,任何内容与数据均与本站无关,如有需要请联系相关搜索引擎包括但不限于百度,google,bing,sogou 等
© 2026 book.tinynews.org All Rights Reserved. 静思书屋 版权所有






![對外經濟貿易大學遠程教育係列教材:公司理財(第2版) [Corporate Finance(Second Edition)] pdf epub mobi 電子書 下載](https://pic.tinynews.org/11223065/rBEQWVF8lVEIAAAAAAcsjtw85eYAAFMOQCm740AByym276.jpg)
![醫學物理學(第8版) 王磊等/本科臨床/十二五普通高等教育本科國傢級規劃教材 [Medical Physics] pdf epub mobi 電子書 下載](https://pic.tinynews.org/11254179/53c4e90fNd17ab593.jpg)
![高等數學疑難問題選講 [Answers to Selected Perplexed Questions in Advanced Mathematics] pdf epub mobi 電子書 下載](https://pic.tinynews.org/11507597/5652a6bbN988aa62c.jpg)

![電磁場與電磁波教學、學習與考研指導/高等學校電子信息類專業係列教材 [Guidance for Field and Wave Electromagnetics:Teaxhing,Leaning and Graduate Student Entrance Examination] pdf epub mobi 電子書 下載](https://pic.tinynews.org/11609562/54a9dc83Ncae06027.jpg)
